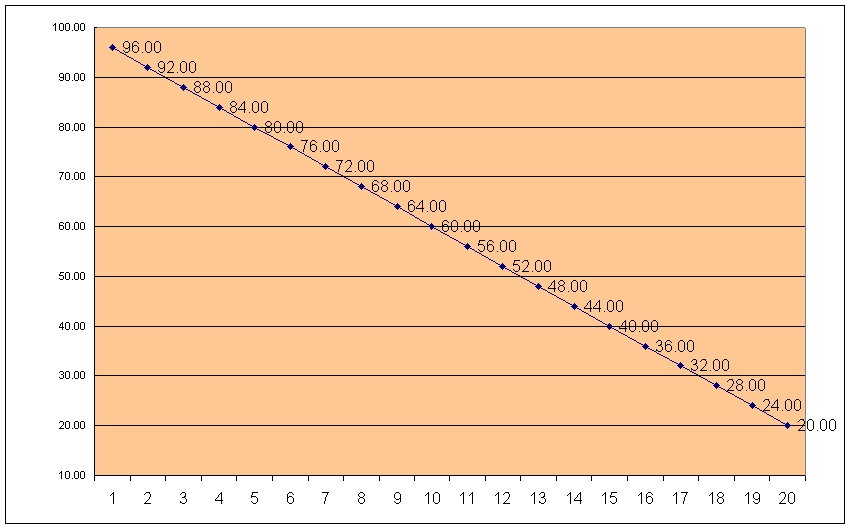
Commodity Graph
This Graph shows:
1) The Commodity returns 3% annually.
2) $100 is the start value; deteriorating to $20 after 20 years.
3) $4 is deducted each year to represent an income need; inflation is 3% annually.
|
Copyright © 1998-2008. All Rights reserved. Terms of Use - Privacy Statement |