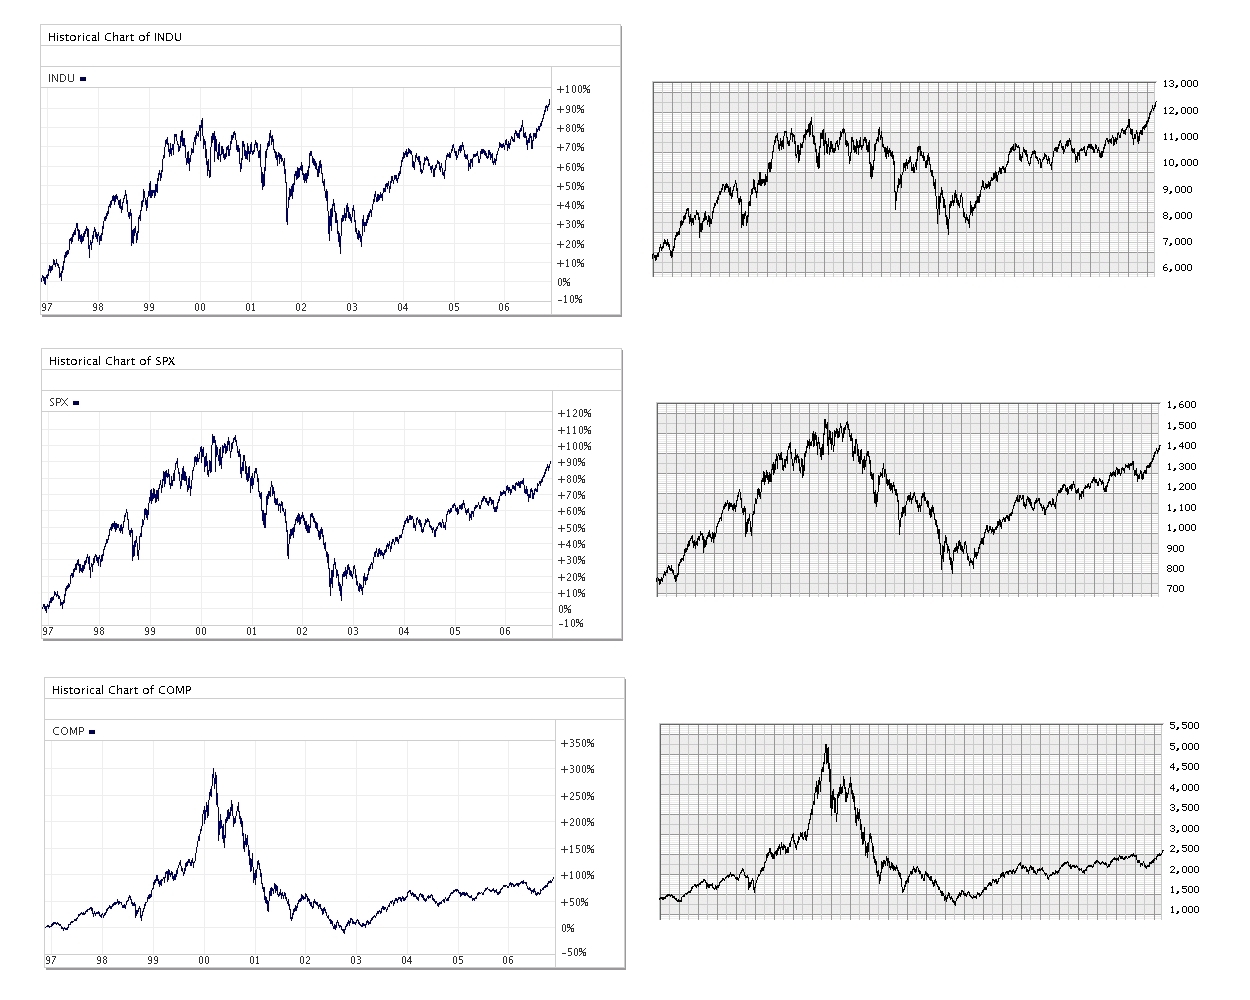
10 years of Performance
These Graphs show the last decade of Stock Market Performance: 1) The Dow Jones Industrial Average 2) The S & P 500 3) The NASDAQ Composite
Return to HOME page